Show Your Stripes Day, celebrated every year around 21 June, is a global moment to share our concern about how the climate is changing and the need for urgent action in our local communities and around the world.
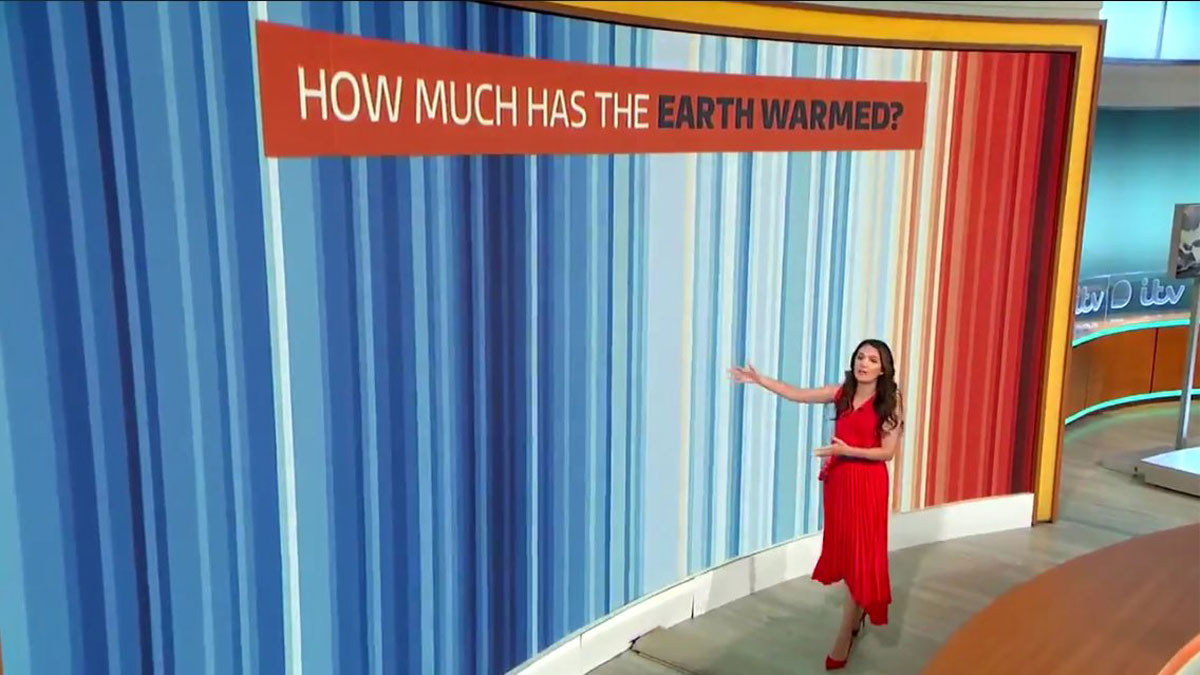
On Show Your Stripes Day, we ask everyone to share the famous “Climate Stripes”, displaying temperatures from their local area – region, country, or even city.
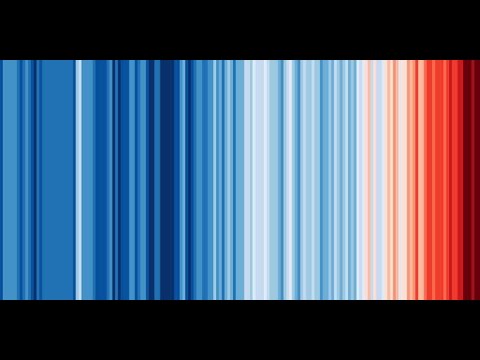
The Climate Stripes, created by climate scientist Professor Ed Hawkins at the University of Reading, powerfully represent how temperatures have increased around the world since the Industrial Revolution. Each stripe represents one year’s average temperature relative to the average temperature of the time period between 1961-2010. The colours transition from cool blues to warm reds to represent the increases in temperature seen throughout the past 150 years or more.
On Show Your Stripes Day we call on individuals, schools and colleges, businesses, and cities around the world to highlight their local climate stripes and share the powerful message they convey.